Analysing .NET code dependencies–Visual Studio Code Maps
This is the second in a series of posts on reviewing tools to help analyse code dependencies in .NET
Code Maps is a feature that was first included in Visual Studio 2012 Ultimate. It remains an Enterprise-only feature in 2015, though Professional and Community editions can view previously created diagrams.
Code Maps operate from the cross-project solution level right down to the method level.
Dependencies
To generate a map of project dependencies, go to the Architecture menu, and choose Generate Code Map for Solution.
A new window opens and gradually items appear on the diagram. Usually this will trigger a build of the solution, and then the analysis process will run, eventually displaying the dependencies between the projects.
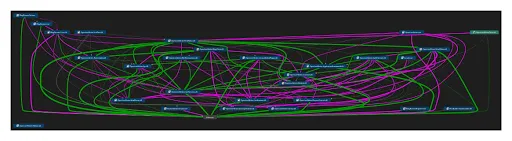
If your solution uses solution folders to group similar projects, then you’ll see that represented in the diagram (the OLW solution doesn’t currently do this).
You can then expand this out by selecting all the nodes (Ctrl-A) and choosing Group, Expand from the context menu.
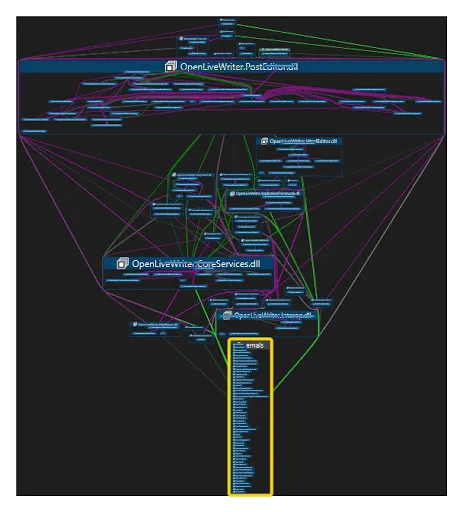
You can see two things – the OpenLiveWriter.PostEditor project seems to be the most significant project, and also there’s an ‘Externals’ block with all external assembly references. To just focus on strictly code from the solution, you can select this group and press Delete. This removes it from the diagram.
Editing a Code Map diagram doesn’t mess with your source code, as the diagrams are a bit like a snapshot of your code at the time they were created. In some ways this is a limitation, but one positive aspect is that you can use Code Map diagrams to model or prototype changes to the class hierarchy and dependencies without having to commit those changes in code.
Let’s focus in on the PostEditor project. If we select that node, we can choose New Graph from the context menu. A separate diagram is now displayed with just the contents of the previously selected node. You can use the Filters tool window to select which elements you want to display. I de-selected Assembly so that I can now focus on the namespaces.
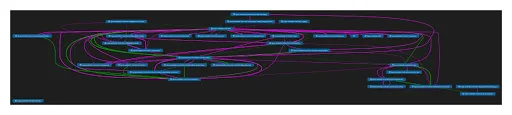
Let’s keep going further in. Select the OpenLiveWriter.PostEditor namespace, and open this in a new graph again. To drill down to the class level, select all nodes again (Ctrl-A) and choose Group, Expand again.
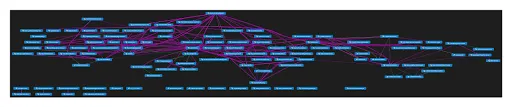
Let’s click on that top node – BlogPostEditingManager. Repeating the same process again, and filtering down to just methods, we get the following:
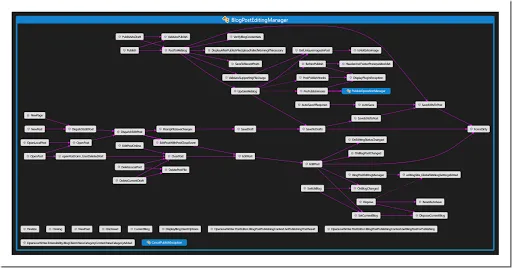
We now have a call graph of the methods inside the class. I also changed the layout for this graph to be ‘left to right’. The two blue nodes represent classes defined inside this class.
Usually, you’d expect to see public methods on the left, and non-public methods going to the right. Unfortunately there’s no way distinguish between them apart from hovering over a node and reading the tooltip that appears, or by selecting a node and reviewing the details in the Properties window.
Debugging
You can also display Code Maps while debugging. If you have stopped at a breakpoint, you can right-click and select Show Call Stack on Code Map.
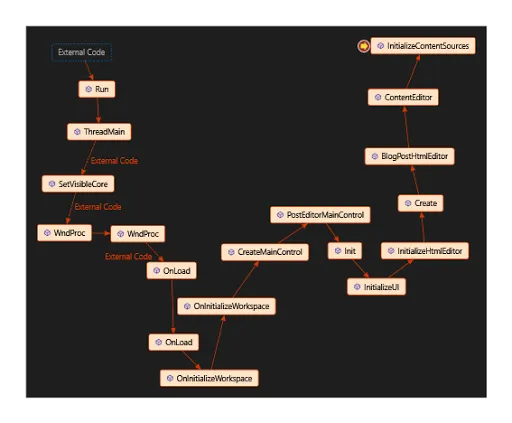
Basically just a different way see the same info that gets displayed in the Call Stack debugging window, and unless I’ve missed something obvious, I think I’ll stick with the latter.
Summary
That’s a quick overview of some of the things that Code Maps can show you. They are entirely visual, so unlike NDepend, there’s no way to do any custom querying out of the box. On the other hand, the fact that the diagrams use DGML (directed graph markup language), it would be possible to write code that queried the file directly.