-
In the garden–Spring 2014
Not a lot of veggies planted at the moment. It has been an unusually warm spring so far. This week we had one day that got up to at least 36°C. That’s more common for January than October.
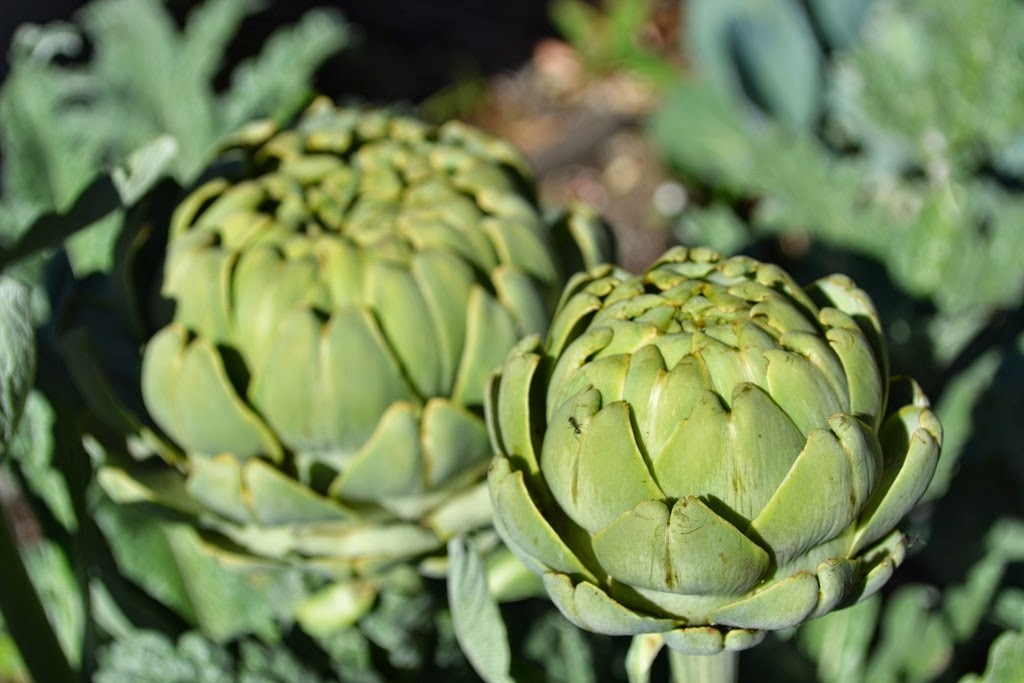
 A globe artichoke that Narelle planted last year has shot up again.
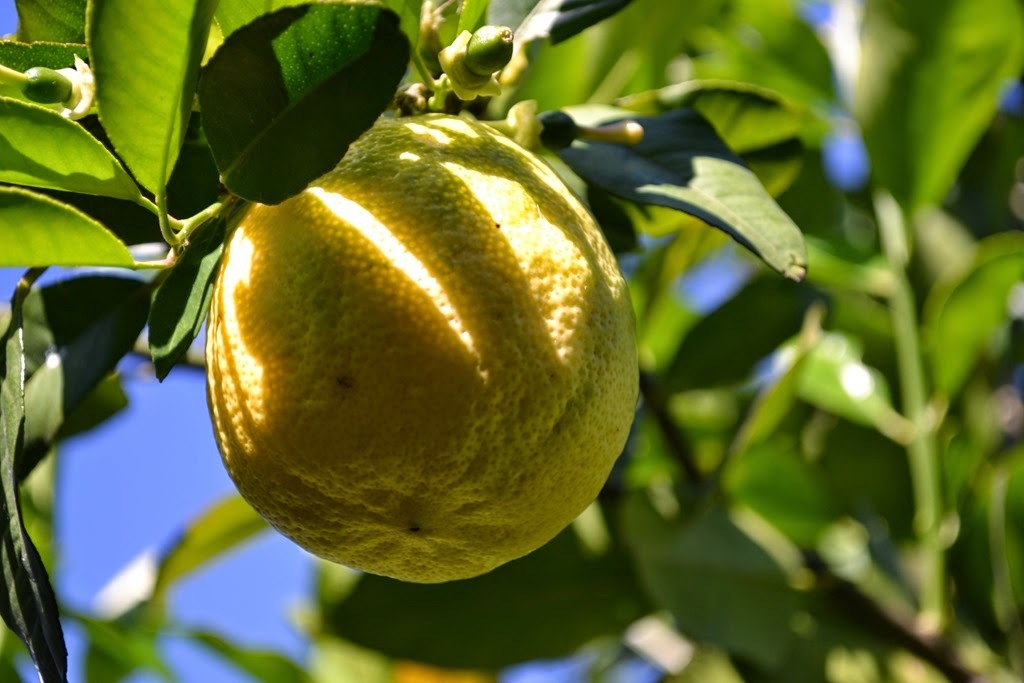
 The lemonade tree has been been very productive again. There’s still a few fruit left. We’ve made quite a lot of juice this year.
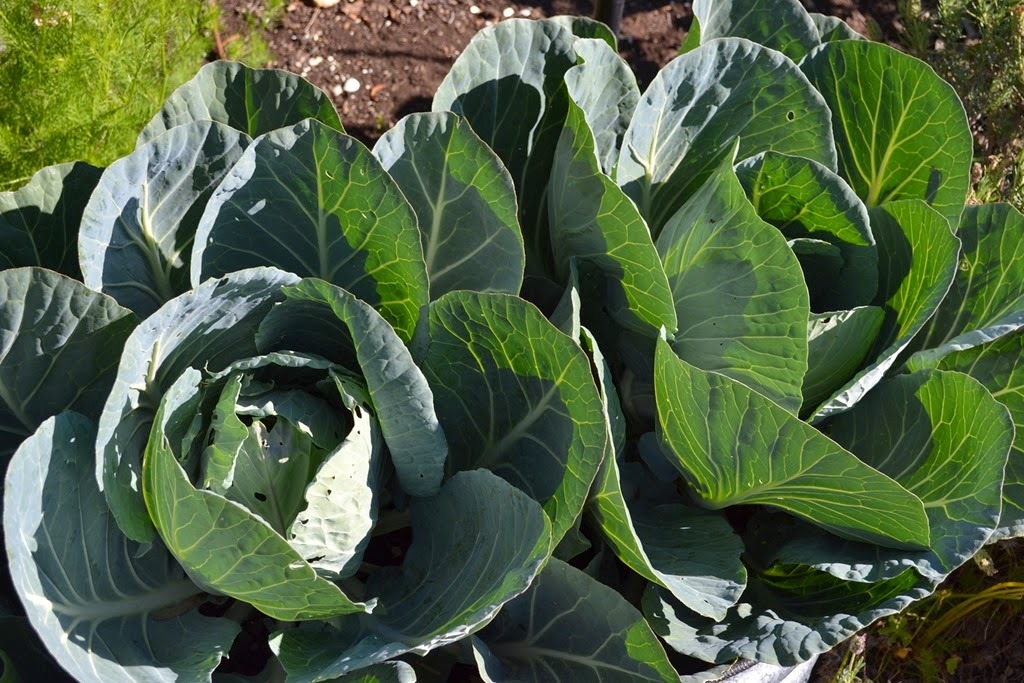
 These cabbages are growing well, though the cabbage moths (well actually their caterpillars) are doing their best to get in first.
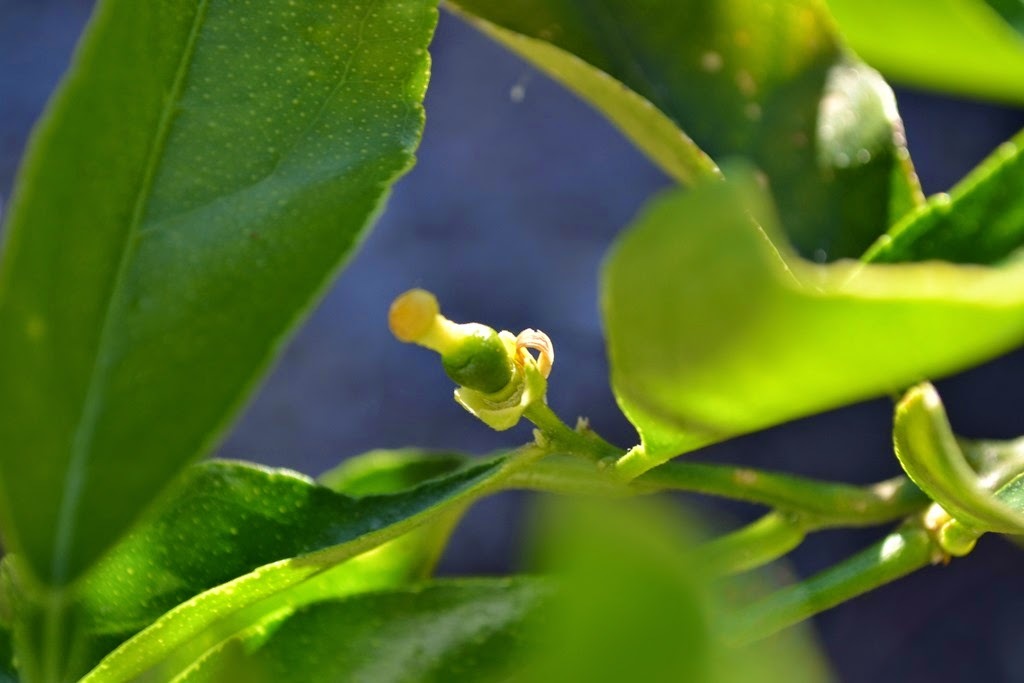
 We planted a lime tree a couple of years ago. It doesn’t like our cold winters, but now the weather has warmed up it has put on a fresh lot of leaves. I’m hoping this tiny fruit will stay on the tree and grow to full size!
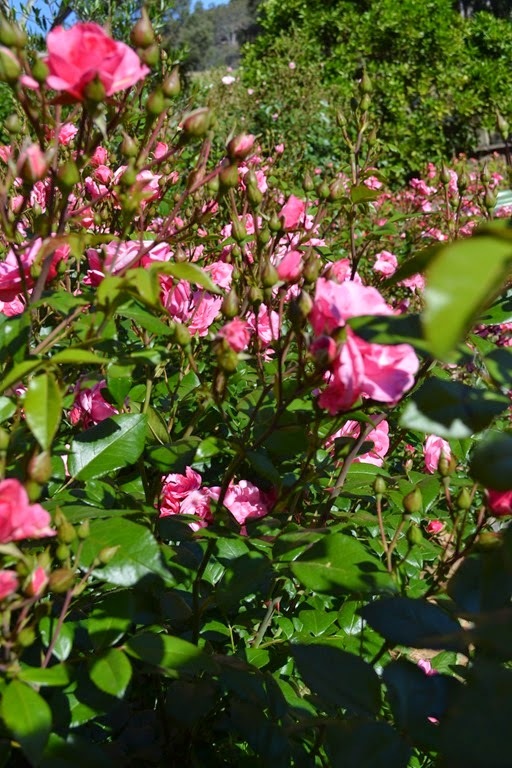
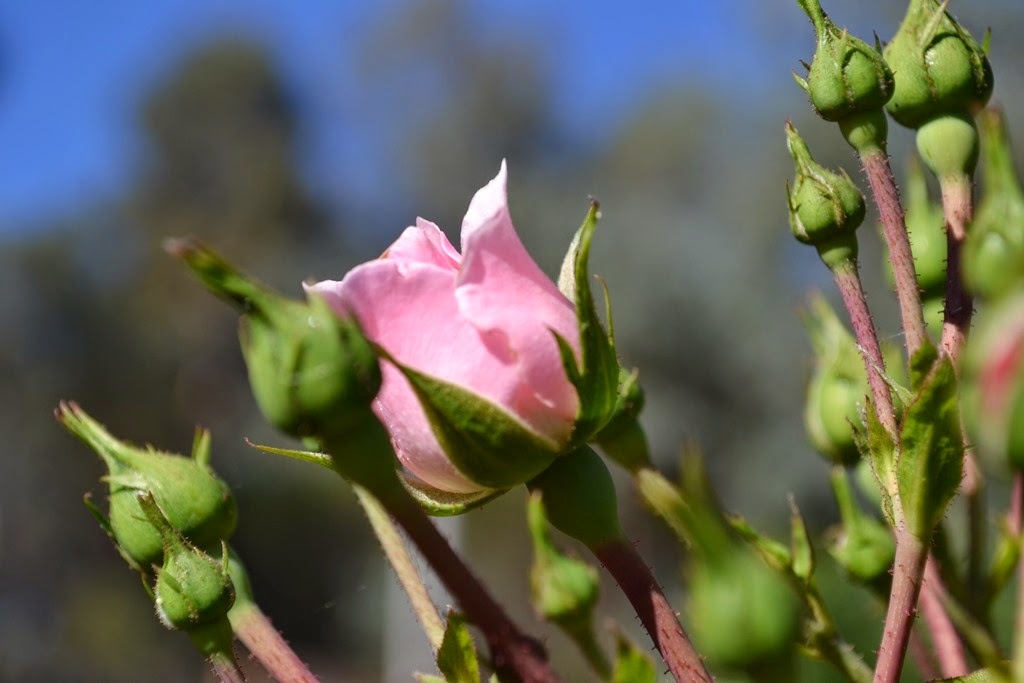
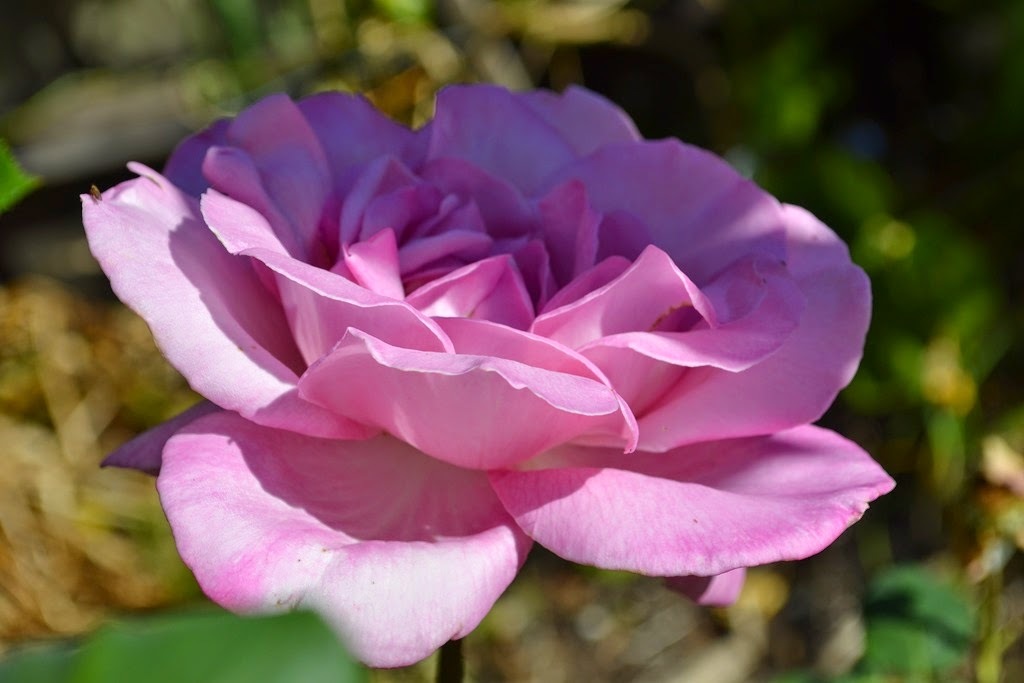
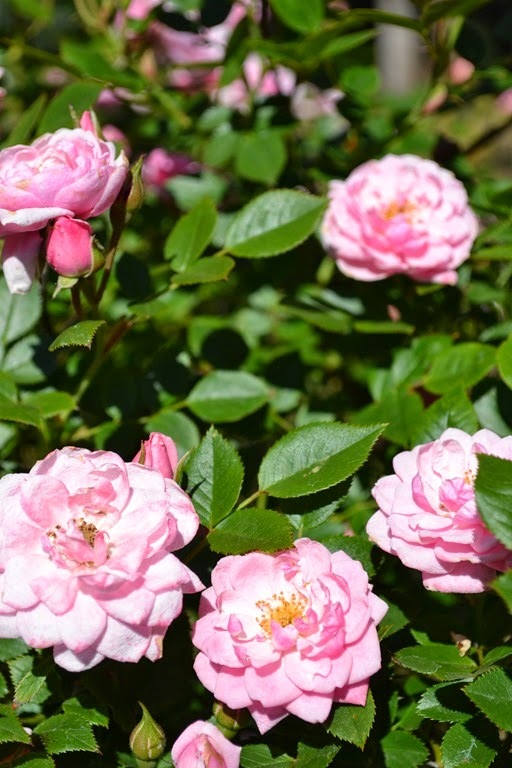
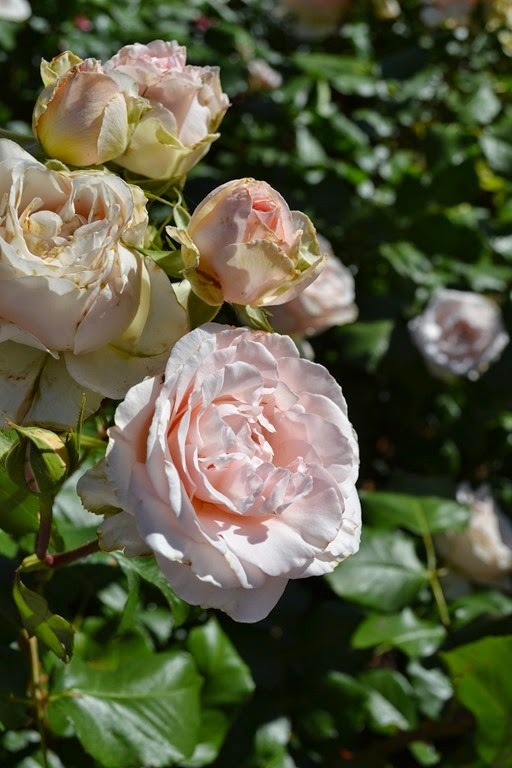
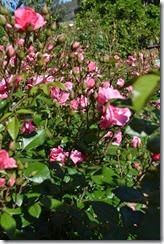
The roses are having their first bloom after winter. They are looking very colourful.


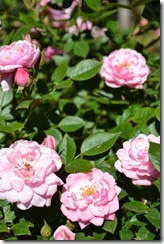


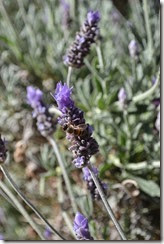
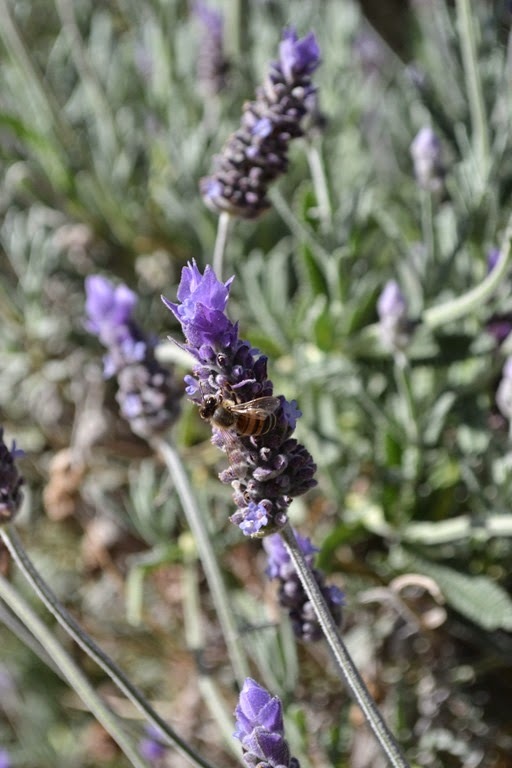
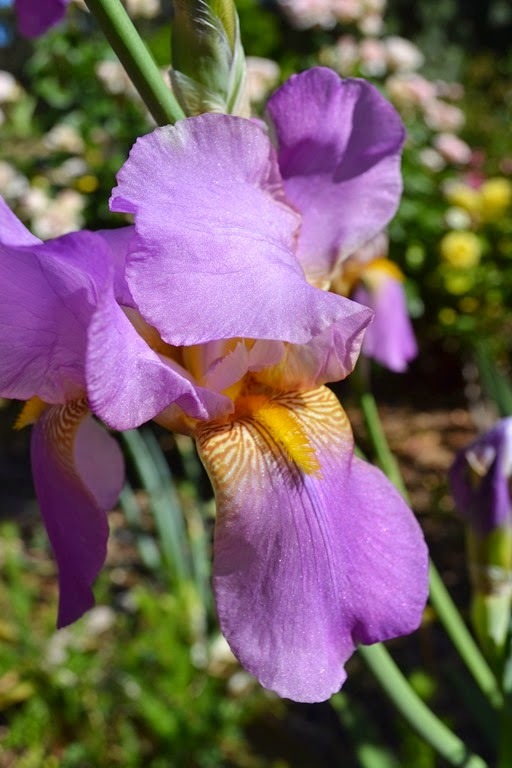
 Lots of lavender and bearded iris are also flowering. The bees really like the lavender.
Plenty of weeding to do at this time of year too – but I’m not going to take photos of those!
-
A healthy start
 This week was my first working for RL Solutions, a software company which provides solutions for the healthcare sector. RL have their main office in Toronto, Canada (checkout the pictures on their careers site). I couldn’t find a bus that would travel that far each day, so (sensibly) I’ve joined the development team based in their Adelaide office.
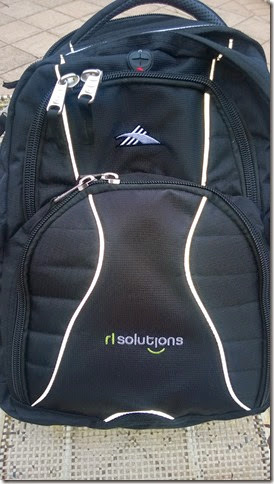 I get the impression from the four interviews I had before being offered the position (including with Sanjay, the founder and CEO) that RL have definite ideas about the kind of people they want to hire (not just looking for technical expertise). One of the things that appealed to me was the approach RL is taking in creating a modern, mature, healthy, fun and social work environment. That seems to manifest itself in a number of ways (some just relevant to Toronto or Adelaide and some in common) and I think it’s a really positive thing.
My first few days have been spent getting to know the other Adelaide staff (helped in no small way by going out to lunch together on my first day), working through the company’s induction programme (they are pretty organised around this), and starting to familiarise myself with the application and codebase that I’ll be calling home.
I will also say it is nice to work in a modern building again – one where you don’t have nagging doubts that the lifts will deliver you to the floor you requested, and that (a bonus for occasional bike commuters) has shower facilities! I’m still in the CBD though, so no changes to my daily commute.
A nice surprise was the ‘welcome’ pack waiting on my desk on my first day – including a company-branded backpack.
It’s going to be an interesting time, especially learning a whole new business (hospitals etc.) – quite a contrast to my previous industry areas of commodity handling and higher education online teaching and learning. It might prove quite useful to be married to someone with a nursing background, not to mention that our family seem to be rather regular consumers of the health system!
I’m looking forward to it 😀
-
The Grand Final
 Yesterday was my last in the office at Eka (formerly MatrixGroup). It was great to catch up with everyone one last time after just over 3 years being on staff. A few final handovers, farewell lunch, attending and presenting at my final Developer meeting and monthly company meeting. I’ll miss working with the people there, but I’d decided it was time to move on.
In the meantime, I’m taking a short break. Time to relax, get some kms on the bike, enjoy Adelaide’s beautiful spring weather, one or two jobs around the house and do some family things for the first week of the school holidays.
After that I’ll be starting something new – more about that in a couple of weeks time!
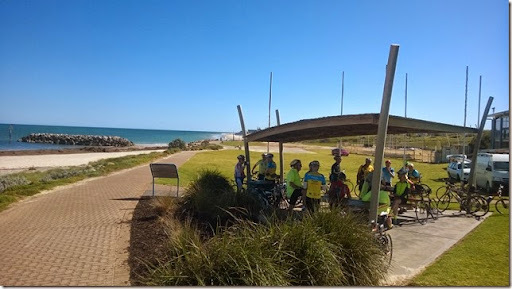
The photo is from my ride on Tuesday with the Mud, Sweat & Gears blokes heading to Outer Harbour. That turned out to be a handy 93km round trip! I must be doing ok as I pulled up pretty well. It is pretty flat for most of the ride, which probably helped.
(Oh yes, it’s also the AFL Grand Final today)
Yesterday was my last in the office at Eka (formerly MatrixGroup). It was great to catch up with everyone one last time after just over 3 years being on staff. A few final handovers, farewell lunch, attending and presenting at my final Developer meeting and monthly company meeting. I’ll miss working with the people there, but I’d decided it was time to move on.
In the meantime, I’m taking a short break. Time to relax, get some kms on the bike, enjoy Adelaide’s beautiful spring weather, one or two jobs around the house and do some family things for the first week of the school holidays.
After that I’ll be starting something new – more about that in a couple of weeks time!
The photo is from my ride on Tuesday with the Mud, Sweat & Gears blokes heading to Outer Harbour. That turned out to be a handy 93km round trip! I must be doing ok as I pulled up pretty well. It is pretty flat for most of the ride, which probably helped.
(Oh yes, it’s also the AFL Grand Final today)

A blog of software development, .NET and other interesting things